
What is Visitor to resident ratio?
Simply stated, the Visitor-to-Resident Ratio (VR ratio) is the proportion of the visitor to residents at the destination calculated by utilizing the device count from geolocation data.
The Visitor to Resident ratio measures the daily ratio of the number of visitor devices in a destination with the number of resident devices.
What does the visitor to resident ratio tell me?
It is used as a measure of understanding the “stress” a visitor economy is placing on the resident quality of life. In looking across partners, VR Ratios less than one have additional capacity to welcome new visitors and the residents are not consistently impacted by visitors to the destination. Between 1 and 1.5 are increasing levels of stress being placed on the residents and we recommend beginning a resident outreach program. Values above 1.5 are typically where we see partners with congestion at key visitation areas, competition for parking, restaurant tables and trail access and greater pushback from the resident community against tourism. At this stage we recommend active resident engagement and visitor distribution strategies.
How is Visitor to resident ratio calculated?
This ratio is calculated as the Daily number of visitors divided by the daily number of local residents in your tourist destination with daily granularity. For example, let's assume you have 1,000 visitor devices and 1,200 resident observed in your destination on one day, you would have a Visitor to Resident Ratio of 0.83. Or in other words, for every 100 residents there are 83 visitors.
What is the source of this data?
This comes from the Zartico Geolocation licensed data set.
What else is good to know about VR ratios?
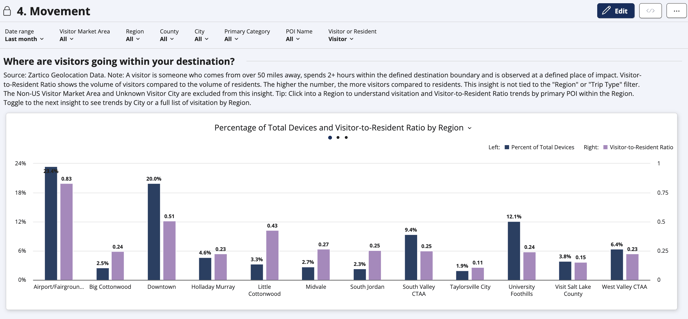
It's also exciting to mention that the visitor-to-resident ratio can be scaled to illuminate insights using the filter at the top of the module. Try adjusting the filters to see how the VR ratio changes based on those new settings.
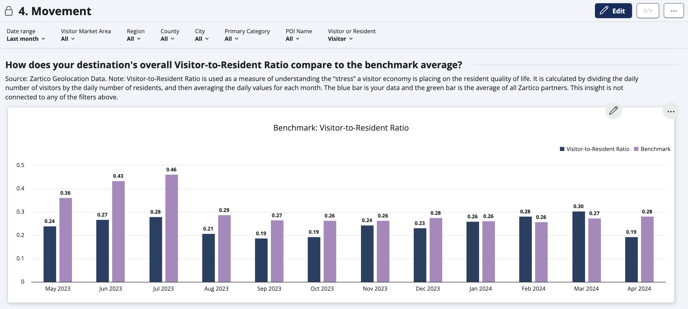
You can also see your visitor-to-resident ratio compared to the Zartico benchmark, which is an average of all Zartico partners.
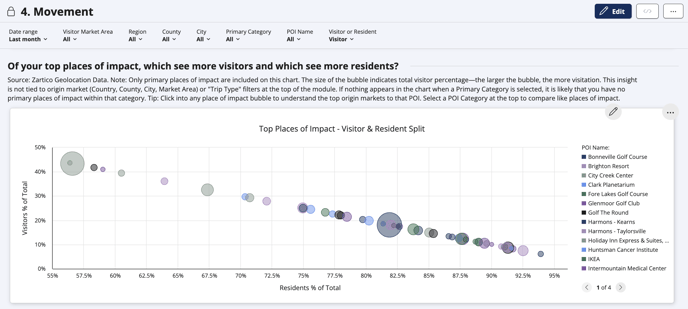
It's also possible to visualize your POIs visited by residents and visitors with this chart below.
Note: While this metric allows you to understand travel patterns and volume at your destination, it is not meant to estimate the total number of visitors at your destination. This is because the devices we measure are a sampling of all devices in the area. Have more questions about this? Check out our article on the Movement module.