Some of the data inside the Zartico Application shows percentages... Let's find out what this means and why it's helpful.
Based on partner feedback and to make insights easier to understand, we have a method to display our licensed data sets that use sample size. Visualizing the data in this way is more consistent with reporting of survey data and other data sets where the analysis is done on a subset of the population, rather than the full population. Want to understand more about using sample-size data? Read about it here!
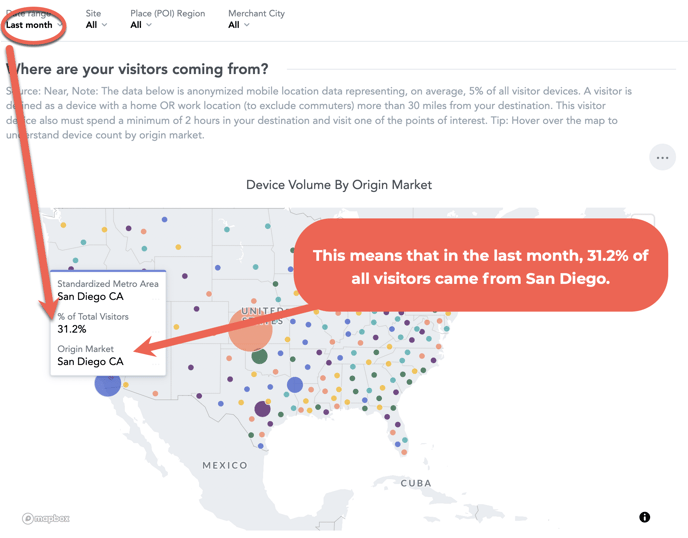
Inside several of the modules in the ZDOS®, you will notice that we present your data to you using "percent of total" instead of whole numbers, such as device count. For example, we are now displaying percentages of total devices instead of normalized device counts, and percent of total spending versus dollar amounts of tourism-related spending. For example, charts will show that 22% of your visitors as opposed to 12,536 devices came from Phoenix.
Both geolocation and spending data are now displayed with percentages of the total from the date range selected, making it easier for you to read and interpret key information.
What does it mean when you see certain data displayed by percentages?
When you see something like "% of total visitors" it refers to the percent of total visitors during a certain timeframe (based on the date range selected in the filters at the top). So the pro tip is to always look at the date range when you are wondering how to interpret a chart that uses percents.
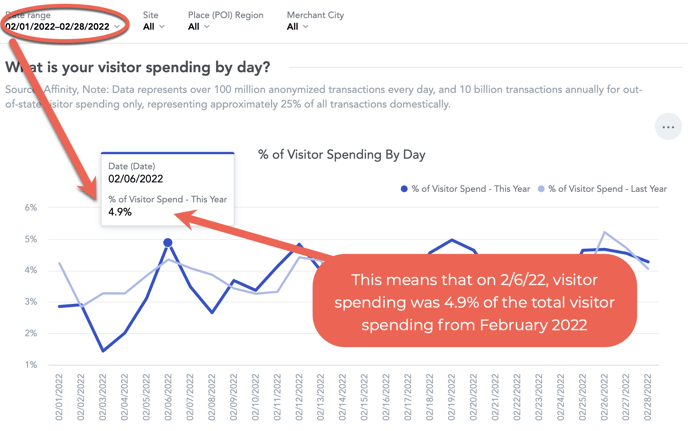
In the Visitor Spending data, when you see "% of visitor spend" it refers to the percentage of visitor spending that occurred during a certain timeframe (based on the date range selected in the filters at the top).
Why is it helpful to use percentages?
Seeing data by percentages can be especially helpful in scenarios where we use sample size in order to determine overall trends. In those cases, we are trying to understand a larger picture by the data we have. It's a common practice to use percentages with sample sizes in this way.
With Zartico geolocation and visitor spending data, we have visibility into reliable sample sizes that are some of the largest commercially available. For these situations, what matters is understanding the whole picture from what we know, so it becomes less work for you to do this by using percentages.
What modules in the Zartico application show these "percent of total" forms of data?
You can find this terminology in charts in the following modules: Destination Awareness, Visitor Flow, Media Planning, and Visitor Spending (this is not reflected currently in custom modules or Director's Briefs).
Why do percentages change as the date range is adjusted?
In working with data displayed by percentages, when the date range changes, the percent of visitors changes. Here's how to think about it: over a 30-day period, we may see 10,000 devices total and on one of those days we see 1,000 devices. That is 10% of that date range. However, over a 90-day period, we may see 50,000 devices total and on one of those days, we would still only see 1,000 devices. Thus, it is 2% of the total. That is how and why the percentage of visitors changes when the date range is changed.
Learn more about sample size!
Zartico's whitepaper on sample size written by our own Alexandra V. Pasi, PhD will help familiarize you with our approach.
Still have more questions? Reach out to us for help.