Anonymized, aggregated comparison of performance against all partners on selected measures. Learn more about benchmarks!
Summary: What is a benchmark?
A benchmark is an evaluation or analysis of a specific metric by comparing it to an external standard. It is often also defined as the process of measuring the success of a product, service, or in our case, destination, by comparing it to organizations known to be leaders in the industry. At Zartico, our benchmarks are anonymized, aggregated comparison of performance against all partners on selected measures.
What does a benchmark do?
A benchmark is the ability to view your data against aggregated performance data of other ZDOS destinations. Benchmarks are intended to help to provide context against the numbers you’re seeing and to generate discussions about strategic and tactical decisions against an external point of reference. They aren’t intended to be a “right” answer or the only course of action for a destination to follow.
How are benchmarks used?
The private sector, uses benchmarks to compare the efficiency and performance of different companies and understand the strategic decisions they are making. A company may deviate from a key benchmark like gross margin or growth rates for very good strategic reasons. Understanding what the benchmark reference is and why one would deviate from that helps to uncover where key strategic choices have been made and where there may be issues requiring remediation.
What criteria does Zartico use in creating benchmarks?
We looked to develop benchmarks where the performance was:
-
Independent of DMO budget, staff size or marketing budget
-
Reflective of the DMOs performance on a key decision or set of decisions
-
Consistent across most, if not all partners
Standards
Consistent data standards across all partners is critical to providing the valuable benchmark insights. Standards ensures reliable measures and consistency over time, which allows us to provide those benchmarks.
The key to benchmarking is to have that external standard set. Within the Destination management industry, you have likely found yourself frustrated by deficient information or disappointed by a lack of universally available data to evaluate your destination's performance compared to the industry as a whole. Zartico is the first Destination Operating System to institute standards across the industry to gain these insights across the board.
Benchmark Frequency
Benchmarks are updated daily and will impact historical benchmarks. What this means is that as new partners join Zartico, their data will be added to the benchmark values daily and historical benchmarks could change.
Example:
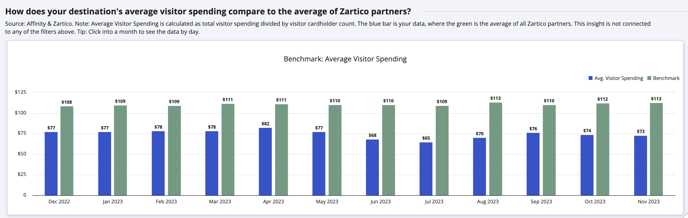
In this example you can see how your average visitor spend (blue bar) compares the overall industry standard, which is a conglomeration of all Zartico partners (green bar).
What Benchmarks can I find in ZDOS®?
These are the insights that you will be able to see as a comparison across all Zartico partners.
Visitor to Resident Ratio:
The Visitor to Resident ratio measures the daily ratio of the number of visitor devices in a destination with the number of resident devices.
Data source: Zartico geolocation data. Learn more about visitor to resident ratio here.
Found in Movement Module 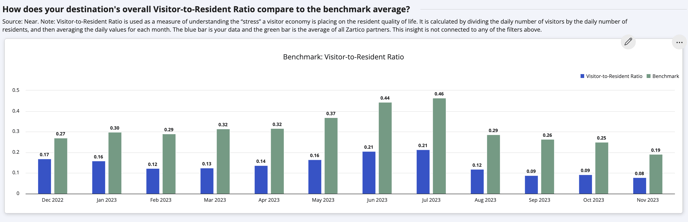
The Average Visitor Spending benchmark is most effectively used as a reference to compare a destination’s visitor spending patterns against an external reference to understand whether they are above, at, or below the national average.
Data source: Zartico spending data
Found in Spending Module

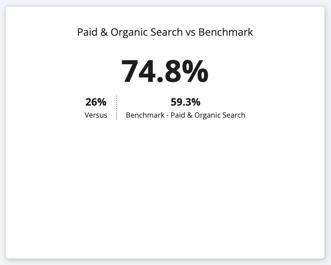
Percentage Paid Sessions + Percentage Organic Sessions (a.k.a Percentage Paid and Organic Search):
Search traffic is an essential diagnostic for a DMO’s digital presence for several reasons. These benchmarks serve as a valuable discussion tool for a DMO’s website, content and digital strategy. In the benchmark’s implementation, both paid and organic search are grouped together, however, we’ve calculated them separately to allow for more advanced analysis to refine a partner’s paid search strategy.
Data source: Google Analytics
Found in:
Paid Search Module: Paid Sessions Benchmark Found in Marketing
Website Content Module: Organic Sessions Benchmark Found in Marketing
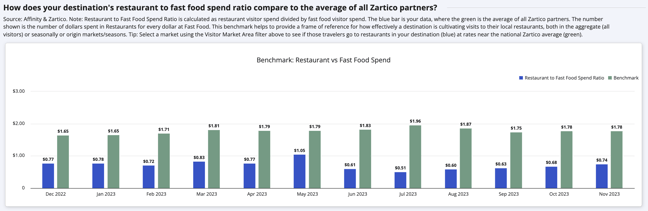
Ratio of Seated Restaurants to Fast Food Restaurants:
This benchmark helps to provide a frame of reference for how effectively a destination is cultivating visits to their local restaurants, both in the aggregate (all visitors) or origin markets/seasons (e.g. Chicago travelers go to restaurants in our destination at rates near the national average).
Data source: Zartico spending data
Found in Spending Module
Retention Rate, Paid & Organic Search:
This benchmark is a measure of the “stickyness” of a website. Retention rate (and bounce rate) are heavily influenced by the route one takes to arrive on the website. In creating a benchmark for retention rate, our goal is to measure the quality of the website and content.
Source: Google Analytics
Found in Marketing: Website Content Module
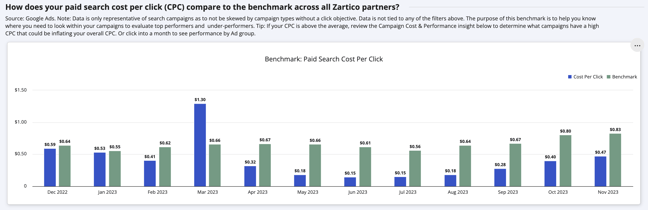
Google Ads: Cost Per Click Paid Search:
The purpose of this benchmark is to help web and content managers know where they need to look within their campaigns to evaluate their top performers and under performers. This benchmark helps with visibility into campaign costs. Source: Google Ads
Found in Marketing: Paid Search Module