Let's dive into more information on dynamic visualizations and how they can help you.
What is a dynamic visualization?
Think of a dynamic visualization as a snapshot in time of some aspect of your destination. A dynamic visualization differs from the data you get within your destination operating system because it is meant to show a specific and fixed timeframe, as a deep dive into targeted data insights.
How does it work to set up a dynamic visualization?
You work through the big questions you have and figure out the best way to go about finding the answer through data. Not sure what your questions are yet? Learn more about the different types of POVs and dynamic visualizations available.
What makes a good dynamic visualization?
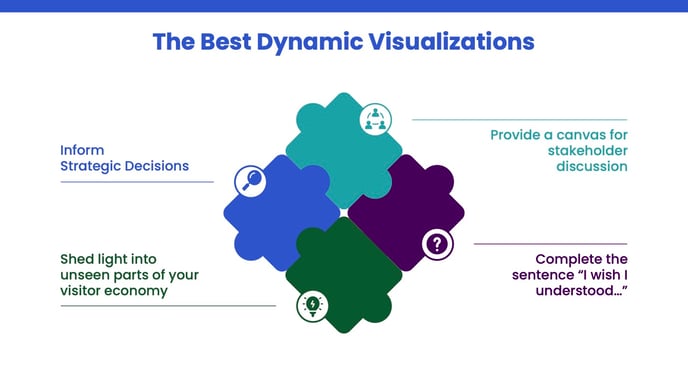
The best dynamic visualizations are ones based on your goals. The best dynamic visualizations are ones that inform strategic decisions, shed light into unseen parts of your visitor economy, provide a canvas for stakeholder discussions, or complete the sentence "I wish I understood..."
FAQs:
Q: What is the recommended timeframe for a dynamic visualization?
A: Because the strategic question you are answering will involve a unique combination of data, you should reach out to your advisor to find out the recommended timeframe.
Q: How many times can I refresh a custom dynamic visualization? (Ex: I have 21 sports tournaments throughout the year at the same POI that I want to monitor.)
A: It very much depends on the specifics involved to determine this, so you can reach out to your CSM to find out for your unique circumstances whether or not you can refresh your dynamic visualization.
Need information on how to use a Kepler map from your dynamic visualization? Click here!