While there is no hard and fast rules to exploring the data offered in your ZDOS®, we have designed these general guidelines to help get you started in your own data analysis journey.
Your ZDOS® offers hundreds of insights and data points based on the volume of data sets and combinations of data sets brought into the system by Zartico, you as the partner, and public data. This can lead some partners to wonder what they should focus on first and how to approach their data to begin understanding their visitor economy.
While there are no hard and fast rules to exploring the data presented in your ZDOS®, we have designed these general guidelines to help get you started in your own data analysis journey. Remember, your advisors are also always just an email or phone call away to help guide you!
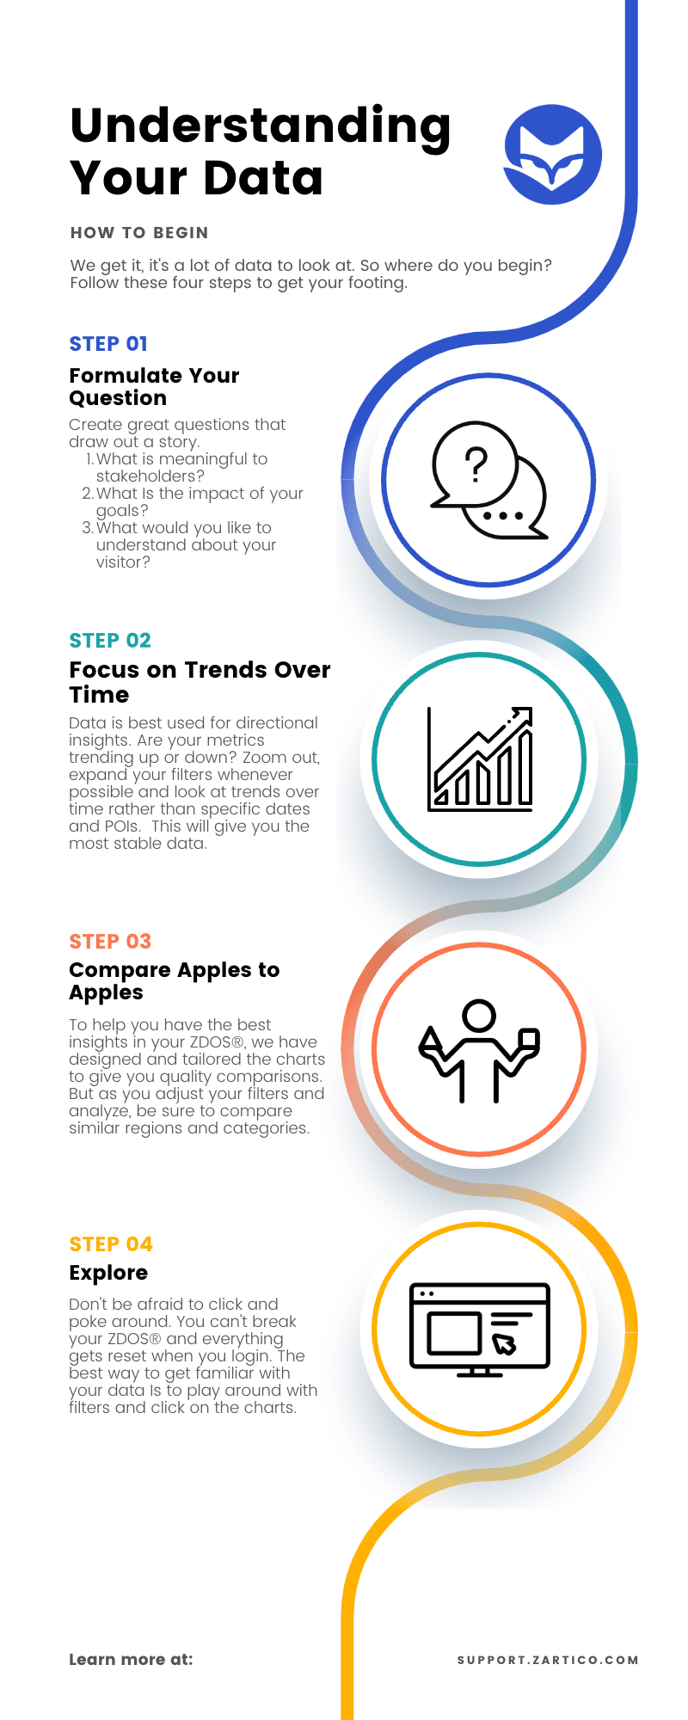
#1 Formulate your question
The data in you ZDOS® can help answer questions about where visitors come from, what specific locations they travel to, what routes they take, how much they are spending and what days and times they travel. Formulating good questions is probably the most valuable tool in your toolbox of understanding the data in your ZDOS®. Why? Because the value of your data is in answering questions with clear and quality insights which create better outcomes for your destination.
How do you create great questions to answer in your ZDOS?
- Consider what is meaningful to stakeholders.
- Create questions that measure impact of your goals.
- Be specific about what would you like to understand about your visitor.
- Define what information will help you refine your marketing and advertising efforts.
- Think about which data and insights will help your stakeholders do their jobs even better.
- Look for ways to you tell the story of the impact of tourism to your destination.
#2 Focus on trends over time
Have you ever seen the painting by Georges Seurat called "Sunday Afternoon on the Island of La Grande Jatte"? It was famously depicted in the movie Ferris Bueller's Day Off when Cameron Frye stares more and more intently at this painting made up of millions of tiny little dots. The more closely you zoom in, the more blurry and distorted the image gets.

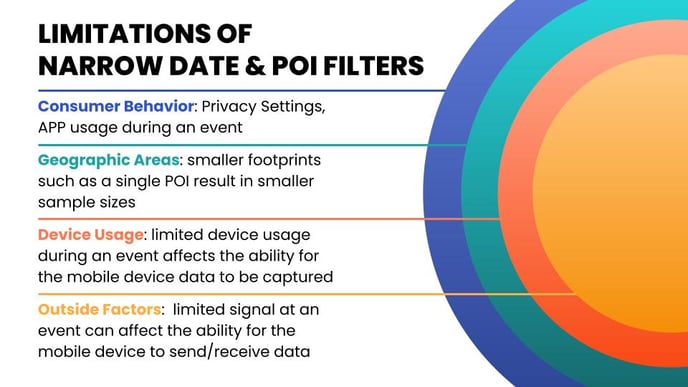
Geolocation data can sometime act like this Seurat painting. When you zoom in too closely to look at a specific POI on a specific date of people from a specific DMA, your data may not give you the perspective or tell the full story that standing back or zooming out can give you.
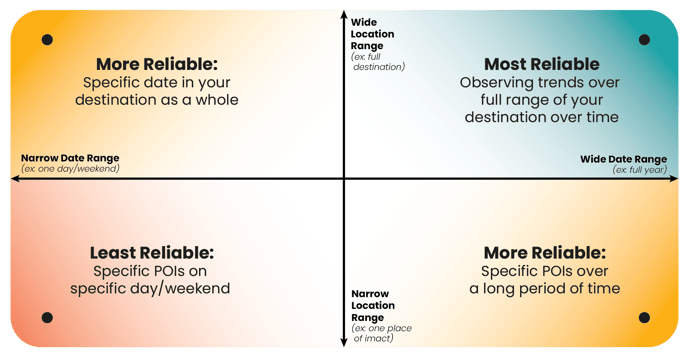
Generally, the nature of observation and measuring data is the more observations you make—that is, the larger your sample is—the more reliable your insights will be. Each time you narrow your filters, you dilute your sample size and therefore increase the volatility of the insight. Our recommendation...Zoom out and look more at trends over time.
Here is one other visual to guide you to the most meaningful and reliable insights.
#3 Always compare apples to apples
One common mistake people often make when looking at data is comparing apples to oranges. It happens more often than not. Faulty comparisons can lead to false insights. For example, you can't compare x to y using z characteristic. It positions one or the other in a more or less favorable position leading to false conclusions. Saying Accommodations perform better than restaurants because the spending it higher is not a fair comparison because the cost of patronizing a hotel is generally greater than dinner at a restaurant.
To help you have the best insights in your ZDOS, we have designed and tailored the charts to give you good comparisons. But as you adjust your filters and explore more in analyze, keep an eye on your comparisons.
Is there ever a time when it's helpful to NOT compare apples to apples?
Of course! Remember, when looking at data, there are rarely hard and fast rules, but helpful guide rails. A good example when it's appropriate to not compare apples to apples is in Benchmarking. These comparisons are similar measurements, but what went into that measurement (marketing efforts, event motivation, seasonal changes) are different. The value of these comparisons is very much in giving you context in a bigger picture.
#4 Explore
Don't be afraid to click and poke around. You can't break your ZDOS and everything will reset when you login. The best way to get familiar with your data Is to play around with filters and click on the charts.