Learn a few best practices as you explore the filters.
We love to say it, "filters are your friends!" The drop down selections at the top of every module are called filters. Filters allow you to narrow and focus the data seen within that module to help you can answer a specific question.
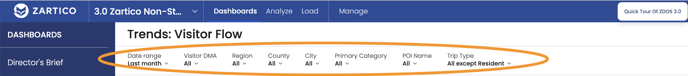
You'll want to play around with the filters, especially those regarding date ranges, when you're getting first getting comfortable in the ZDOS®. Explore these filters and how they focus your data on the dates, geographic regions, or place categories you are tryin to understand.
Best practices for using filters:
“When dealing with data sets with a smaller sample size, the question of sample representivity and methodological design becomes increasingly important. A data set with a small, unrepresentative sample provides ambiguity at best, and misdirection at worst.” - Alexandra V. Pasi, PhD Zartico Director of Data Science
- Watch the sample size.
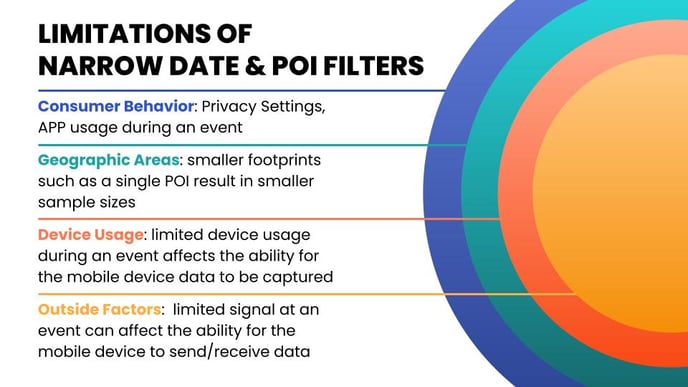
While we bring in the largest data sets available, as you narrow the focus using multiple filters it will effect the sample size. Statistically, the more narrowly your filter and reduce the sample size, the more skewed you data could be. We've included the sample size calculator on each module to help you monitor the sample size. If the number turns yellow or red, you may want to expand your filters to ensure you are seeing the most reliable data.
Sample size is in the Module summary,
And at the bottom of the module.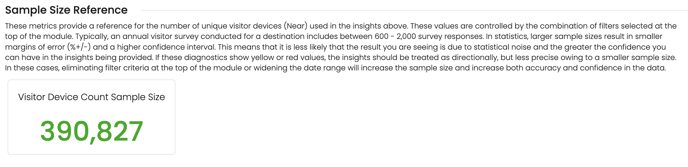
- Use "static date" when looking at Year-over-Year insights. When looking to compare a full year, the best practice is to select the date range using "static date" in the date range filter. this is because using "This year" will show year to date, but will compare to a full calendar in previous year results.
Similarly, to view data for previous years, use the static date feature. (Example: To view 2019 data). If you are not seeing the % change feature using static period, try using relative date.
Learn more on using the date filter here. - Be aware of data lags. There is some processing time between the end of the day and month for bringing data into the ZDOS. There is a delay between the end of the month and when STR data is available in the ZDOS and an eight day lag in geolocation data in the ZDOS. This data is updated regularly and timely, but it is important that you know the processing times for each of these when pulling data for the most recent time periods.
- Use number of days = 7. When looking at weekly trends, you will want to set your date range to no more than 7 days (ie Sunday-Saturday). This is because if you select 8 days starting on a Wednesday (ie Wednesday to Wednesday), more Wednesdays will be listed than other days of the week and it could look like visitor counts are higher.
FAQs
Why are there extra counties or cities listed in my drop down filters?
The initial resolution we selected to assign cities to POIs was broad and therefore bringing in many counties or cities that border our partners destinations. We are working on a solution that will narrow the resolution to remove border geographies brought into the filters. We do filter out the data from those bordering counties and cities on the back end so your data is limited to only activity within your destinations boundary. Your data displayed is accurate and this only effects the selections in the drop down filters.