Your spending data got a refresh, incorporating next-level precision in how it is processed and displayed!
We are always looking for ways to improve the ZDOS, and this latest effort has to do with refining our visitor spending data.
Where does spending data come from? The raw data that makes up Zartico spending data comes from our partner, Affinity. We process and purify this data to display it in a way most relevant to what you need to see about your destination.
In this latest release, we have...
-
Updated the spending data pipeline to utilize the same geocoding standards used by the location pipeline, to determine where a transaction took place in a destination - This makes your data more aligned and accurate.
- Created more accurate resolution where spend is occurring in a destination through the incorporation of zip code tabulation areas - By taking things to a zip code level in this new way, it means more accuracy in where you see spend occurring by city.
-
Loaded historical data back to 2021 for current or recent implementation partners - Due to a bug, some partners had a gap in how far back in historical data they were able to see.
- Eliminated the Commercial primary category for Visitor Spend (MCC 5399 and 7299) - This category has been deemed not helpful to see in the context of what visitors are spending in tourism-related categories, so it has been voted off the island.🏝️
-
Filtered the standard Avg. Visitor Spending metric to only show if more than 10 cardholders are present in the data depending on the filters and how the data is sliced - This keeps the sample size large enough to not let one large unusual transaction cause a visitor market to appear more influential than it is.
What does this mean?
Your data will be more accurate! Because of this refinement there are two other things you may notice...
- A slight variation in your Average Visitor Spend Amount when you look at a more granular level. This is due to the further criteria we have added when processing your data.
- Some cities will appear to not have data when you dig into the most granular levels and the data includes less than 10 devices
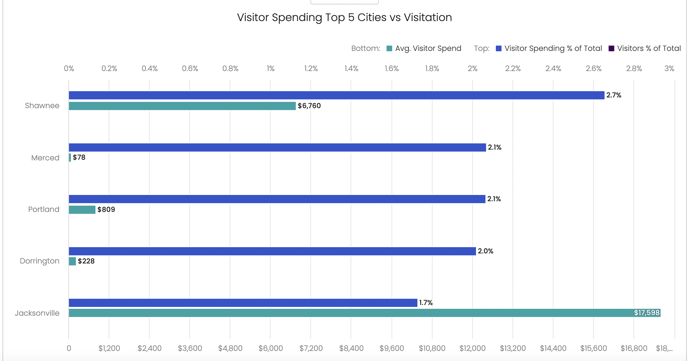
Example of what this may have looked like before, where a few outliers in a small sample size could appear to skew your data:
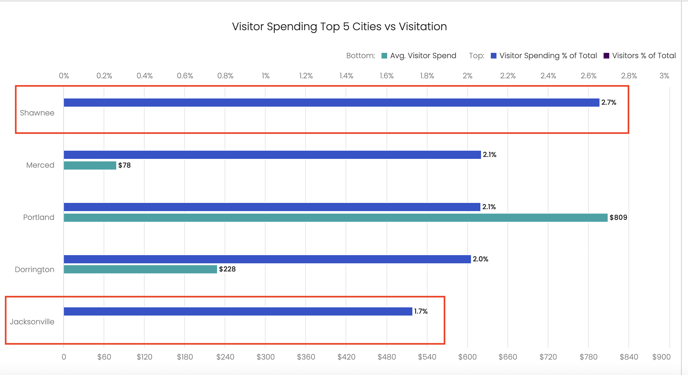
Example where the minimum sample size rule is at play, hiding data that comes from a sample size of less than 10 devices:
These improvements will make this data even more helpful to you, but if you have used your previous data for reporting or decision-making, you can stand by that data as well-- This is just the next evolution in clarity!