Use this cheat sheet to understand some of the most common metrics used in within the Analytic Designer
Common Goals and What Metrics to Use:
Download a cheat sheet of these common metrics here.
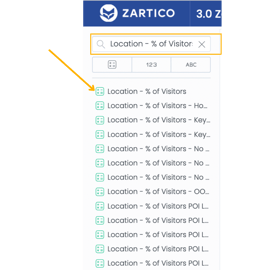 Metric: Location - % of Visitors
Metric Description: This metric calculates the percentage of all your visitors by whatever attribute you slice the insight by. The “by all other” clause in this metric overrides all attributes - keeping the metric from being broken down at all. Meaning, the denominator will remain at the highest level of aggregation. Please note, when calculating visitor device counts, this value is always deduped.
When to Use: Most often this metric is used to show the percentage of all your visitors by Visitor Market Area, Region, POI, etc. This metric should always be used with an accompanying attribute. If this metric is not sliced by an attribute, the resulting value will always be 100%.
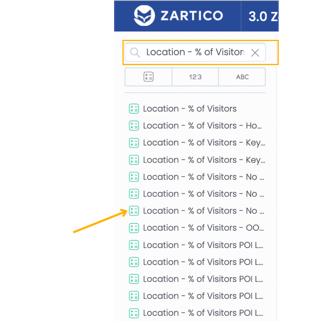
 Metric: Location - % of Visitors - No Empty Value
Metric Description: This metric calculates the percentage of all your visitors by whatever attribute you slice the insight by, but will exclude visitors from outside the US from the entire calculation. The “by all other” clause in this metric overrides all attributes - keeping the metric from being broken down at all. Meaning, the denominator will remain at the highest level of aggregation. Please note, when calculating visitor device counts, this value is always deduped.
When to Use: This metric is most often used with the “Visitor Market Area” attribute when researching origin markets. This metric should always be used with an accompanying attribute. If this metric is not sliced by an attribute, the resulting value will always be 100%.
 Metric: Location - % of Visitors - No Empty Value, Home
Metric Description: This metric calculates the percentage of all your visitors by whatever attribute you slice the insight by, but will exclude visitors from your Home Market Area(s) and outside the US from the entire calculation. The “by all other” clause in this metric overrides all attributes - keeping the metric from being broken down at all. Meaning, the denominator will remain at the highest level of aggregation. Please note, when calculating visitor device counts, this value is always deduped.
When to Use: This metric is most often used with the “Visitor Market Area” attribute when researching origin markets, and the home Market Area is usually already under consideration. This metric should always be used with an accompanying attribute. If this metric is not sliced by an attribute, the resulting value will always be 100%.
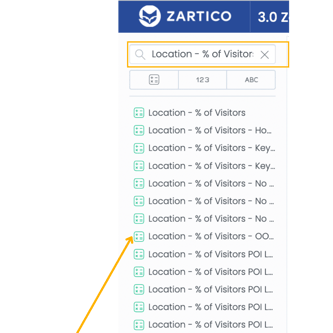 Metric: Location - % of Visitors - OOB
Metric Description: This metric calculates the percentage of all visitors to out-of-boundary (OOB) POIs by whatever attribute you slice it by. The visitor would not need to also be seen in your boundary to be counted here. The “by all other” clause in this metric overrides all attributes - keeping the metric from being broken down at all. Meaning, the denominator will remain at the highest level of aggregation. Please note, when calculating visitor device counts, this value is always deduped.
When to Use: Most often this metric is used with the “POI Name” attribute to show the top visited OOB POIs or with the “Visitor Market Area” attribute to show the origin markets visiting those OOB POIs. This metric should always be used with an accompanying attribute. If this metric is not sliced by an attribute, the resulting value will always be 100%.
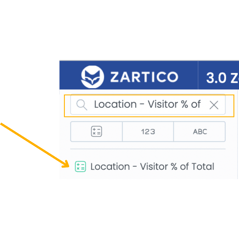 Metric: Location - Visitor % of Total
Metric Description: This metric calculates the percentage of total devices observed that are defined as visitors. Please note, when calculating visitor or total device counts, this value is always deduped.
When to Use: This metric is most often used alone with no attribute to show the percentage of total devices in a destination that are visitors, or with the “POI Category” attribute to show of devices seen at a POI Category what percentage are visitors. This helps to determine if certain POI Categories or POIs skew more visitor or resident.
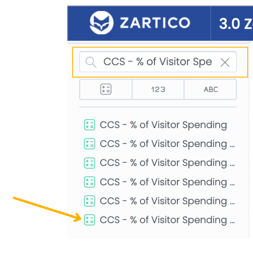
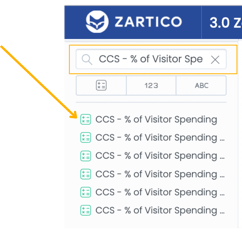 Metric: CCS - % of Visitor Spending
Metric Description: This metric calculates the percentage of all your visitor spending by whatever attribute you slice the insight by. The “by all other” clause in this metric overrides all attributes - keeping the metric from being broken down at all. Meaning, the denominator will remain at the highest level of aggregation.
When to Use: Most often this metric is used to show the percentage of all your visitor spending by Visitor Market Area, Region, POI, etc. This metric should always be used with an accompanying attribute. If this metric is not sliced by an attribute, the resulting value will always be 100%.
Metric: CCS - % Visitor Spending - No Empty, Home
Metric Description: This metric calculates the percentage of all your visitor spending by whatever attribute you slice the insight by, but will exclude visitor cardholders from your Home Market Area(s) from the entire calculation. The “by all other” clause in this metric overrides all attributes - keeping the metric from being broken down at all. Meaning, the denominator will remain at the highest level of aggregation.
When to Use: This metric is most often used with the “Visitor Market Area” attribute when researching origin markets, and the home Market Area is usually already under consideration. This metric should always be used with an accompanying attribute. If this metric is not sliced by an attribute, the resulting value will always be 100%.
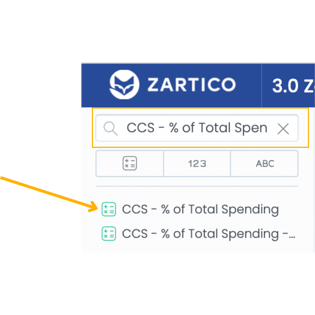 Metric: CCS - % of Total Spending
Metric Description: This metric calculates the percentage of all your spending (visitor and resident) in destination by whatever attribute you slice the insight by. The “by all other” clause in this metric overrides all attributes - keeping the metric from being broken down at all. Meaning, the denominator will remain at the highest level of aggregation.
When to Use: Most often this metric is used to show the percentage of all your spending by Visitor Market Area, Region, POI, etc. This metric should always be used with an accompanying attribute. If this metric is not sliced by an attribute, the resulting value will always be 100%.
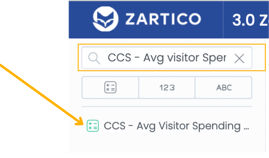 Metric: CCS - Avg. Visitor Spending
Metric Description: The metric calculates the average spending per visitor cardholder.
When to Use: Use this metric to determine the average visitor spending for a date range, Primary Category or City.
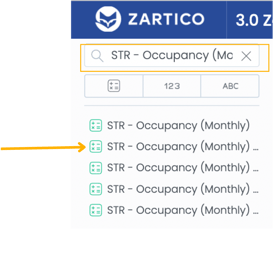
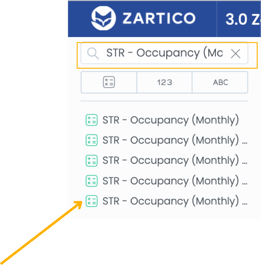
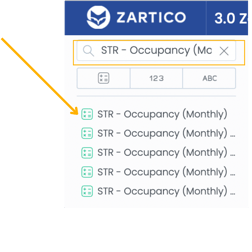 Metric: STR - Occupancy (Monthly)
Metric Description: This metric averages the occupancy across all segments in your Monthly STR report. It is divided by 100 to display as a percentage. Please note, when averaging more than one month it is averaging occupancy rather than using the raw device counts of demand and supply.
When to Use: Use the metric when segments an insight by the “STR Geography” attribute. If you do not segment by STR Geography, you are averaging the other segments in your report, like your comp set, in with your destination.
 Metric: STR - Occupancy (Monthly) - Primary
Metric Description: This metric averages the occupancy for only your primary geography in your Monthly STR report. Your primary geography is a setting in the backend of your ZDOS that is set during implementation. You can find the input for this setting at the bottom of your Lodging Hotel - Monthly module in the “STR Diagnostics” section.
When to Use: Use this metric when you only want to look at your STR performance. Most often this is used to see how your STR performance changes over time.
 Metric: STR - Occupancy (Monthly) - Primary 2019
Metric Description: This metric averages the occupancy for only your primary geography in your Monthly STR report for only the year 2019. This is just an example, but there are metrics for several years in your ZDOS. Your primary geography is a setting in the backend of your ZDOS that is set during implementation. You can find the input for this setting at the bottom of your Lodging Hotel - Monthly module in the “STR Diagnostics” section.
When to Use: Use this metric when you only want to look at your STR performance and compare it over several years. For example, compare 2019 STR performance to this year’s performance.